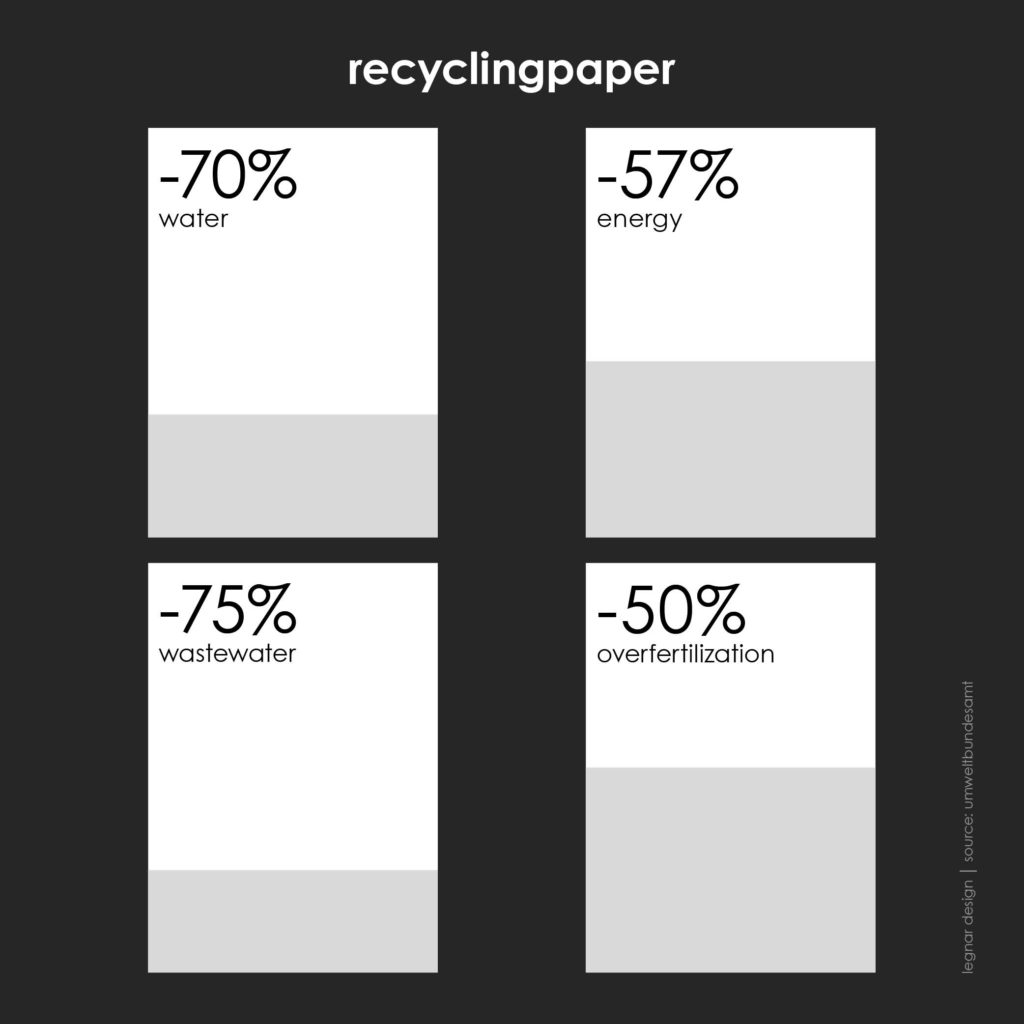
the chart shows the reduction of resources, but also of pollutions through the production of recycled paper. the grey areas represent the proportions required for the production of recycled paper compared to paper made from fresh fibres (white). this is an easy way for sustainable production.