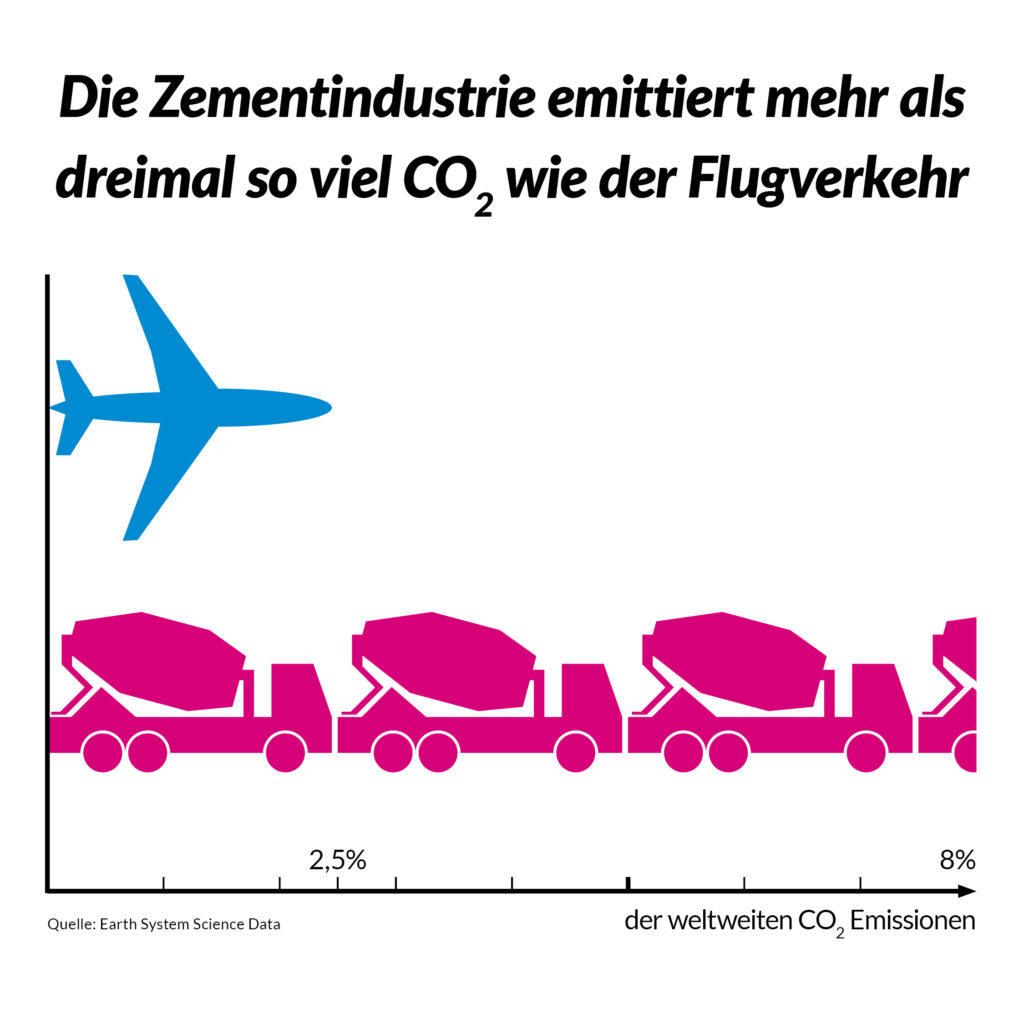
the social media chart compares the amount of worldwide co2 emissions by air traffic and cement industry by using the typeface and colors of the corporate design.