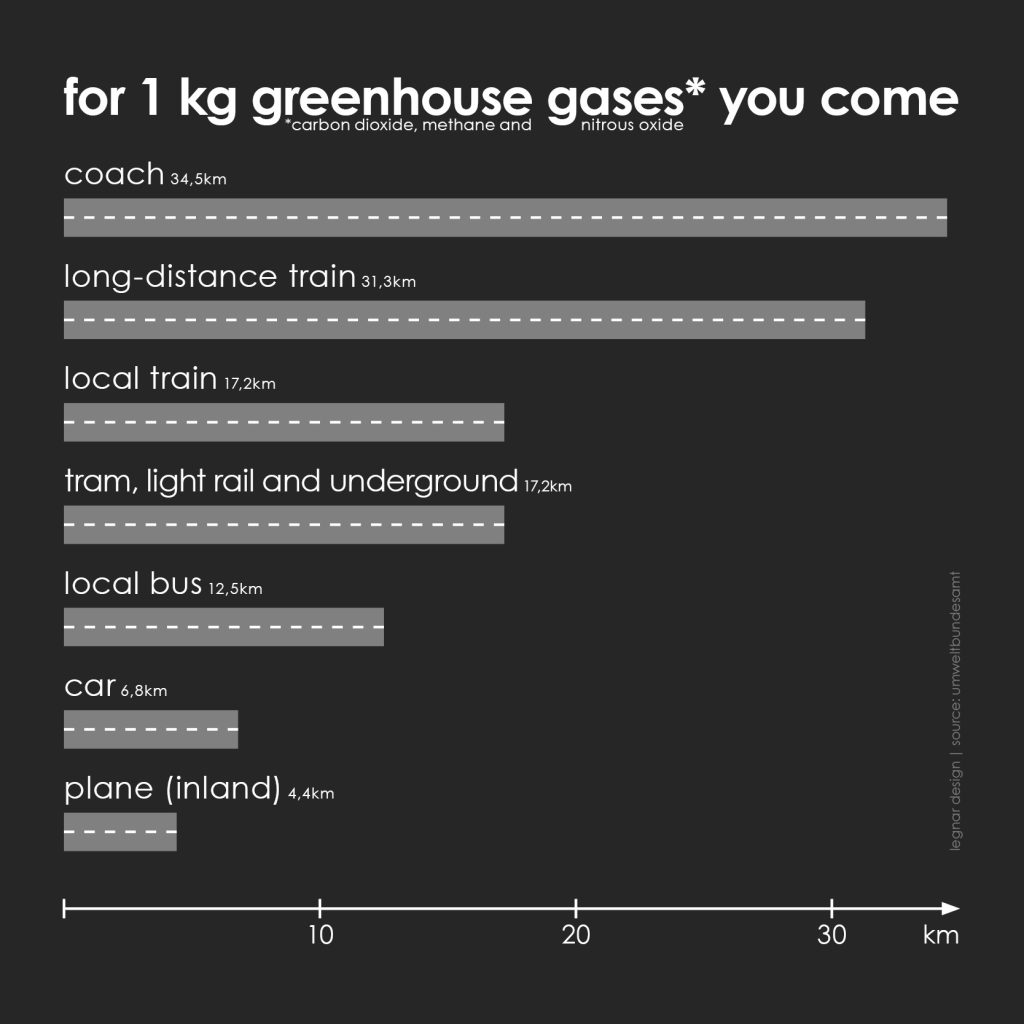
the diagram shows how many kilometres you can travel with different vehicles for 1 kilogram of greenhouse gases (carbon dioxide, methane and nitrous oxide). the bar chart is translated into roads according to the topic.
the diagram shows how many kilometres you can travel with different vehicles for 1 kilogram of greenhouse gases (carbon dioxide, methane and nitrous oxide). the bar chart is translated into roads according to the topic.