the double page of the leporello shows one infographic on each spread. on the left side a chart shows the amount of people wearing a kilt during 24 hours. on the right side icons show the amount of used drinking horns.

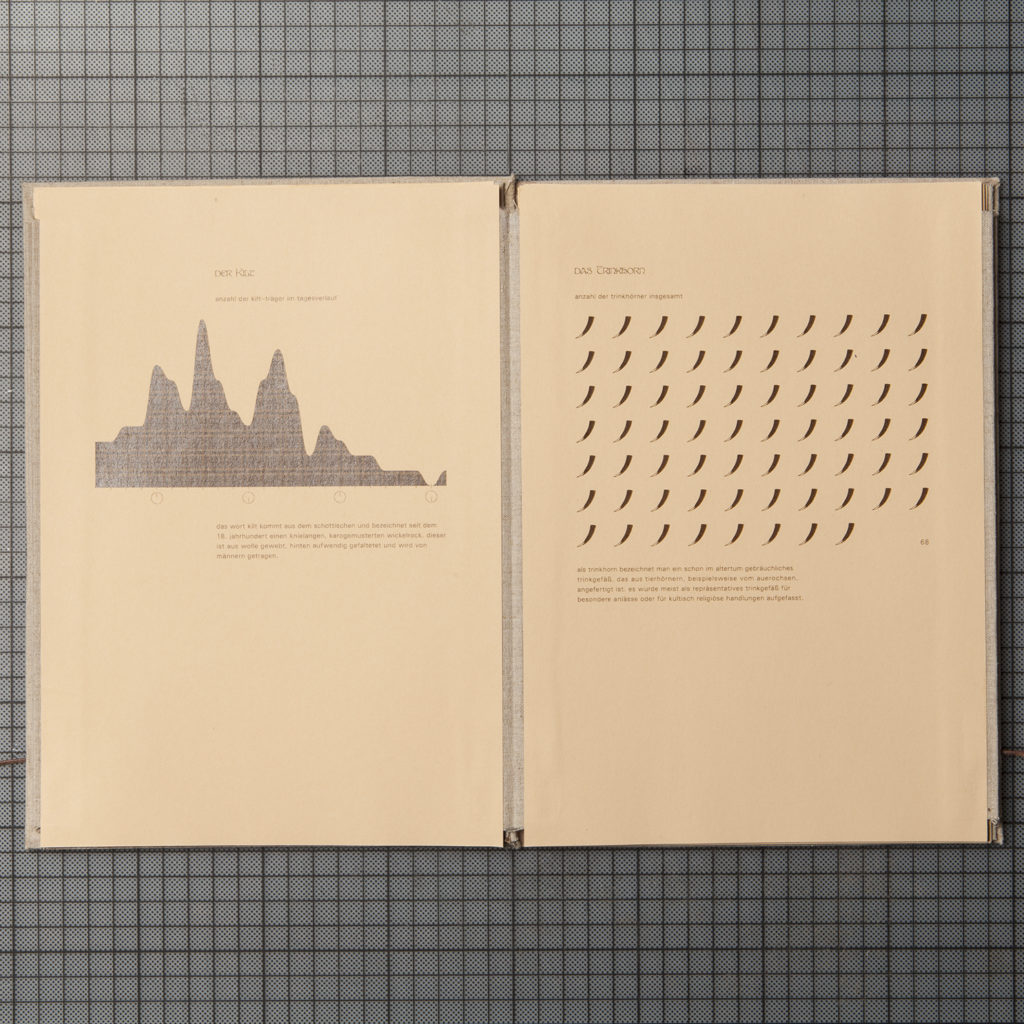
the diagram on the left in check patterns shows the number of kilt bearers. the horns on the right represent the number of drinking horns counted.